
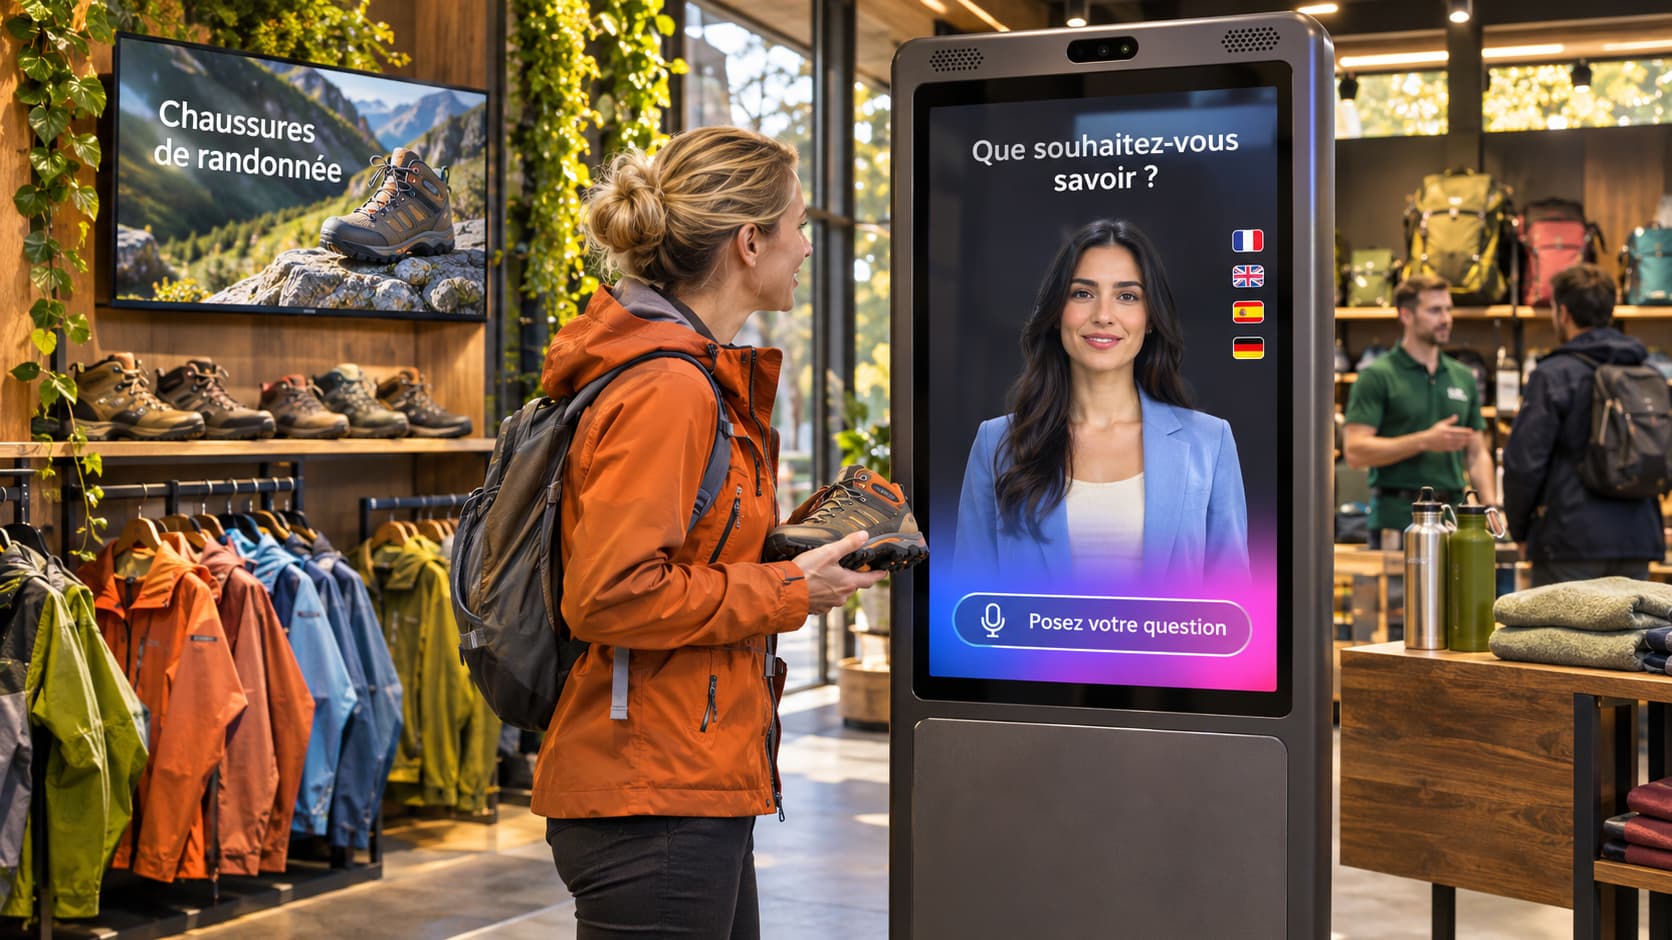
Quick introduction: the measurement challenge
An in‑store AI avatar project typically aims to improve customer experience and support commercial objectives. To convince leadership and budget a pilot, qualitative arguments alone are not enough. You need a clear measurement protocol, relevant business and technical KPIs, and an attribution plan that links avatar interactions to operational outcomes.
This guide proposes an operational method to define those indicators, design a robust experiment and produce an actionable dashboard, while respecting data privacy and integration constraints.
Which KPIs to prioritize for a store pilot
Before listing metrics, identify the pilot objectives: reduce repetitive enquiries, direct customers to products, improve perceived satisfaction, support a promotional area, or drive upsell. The KPI choice follows directly from that objective.
The following KPIs form a prioritized inventory to adapt to your context.
Business and commercial KPIs: volume of visits influenced by the avatar, engagement rate (visitor interacting by voice or touch), redirection rate to a product category, average basket value of visitors who interacted versus those who did not, conversion rate in store attributable to the interaction according to the chosen attribution method.
Operational KPIs: average interaction duration, average time spent in aisle after interaction, share of promotional information consulted following the exchange, number of questions resolved without human intervention.
Technical and quality KPIs: ASR comprehension rate for voice interactions, relevance/accuracy of responses identified during tests, technical failure rate (timeouts, TTS/LLM errors), kiosk/screen availability.
Adoption KPIs: proportion of exposed visitors who initiate an interaction, user recurrence over a given period when anonymous identification is possible.
Compliance and privacy KPIs: volume of data collected per interaction, proportion of voice interactions retained according to retention rules, consent rate when required.
Experimentation methods suited to retail
Three experimental approaches are most used to measure the impact of an in‑store AI avatar: A/B testing, cohorts and before/after comparisons. The choice depends on operational constraints, number of stores and availability of data sources.
A/B test: randomly assign stores or time slots to variant A (without avatar) and variant B (with avatar). Measure the defined KPIs and compare results between groups. Random assignment ensures a robust comparison when randomization is possible.
Cohorts and matching: when full randomization is not possible, create cohorts of comparable stores based on profile (size, traffic, assortment) and apply matching methods to limit bias. This protocol is useful for multi‑site pilots where logistical constraints prevent pure A/B testing.
Controlled before/after: compare the period before activation of the avatar to the period after, adjusting for seasonality and promotions. This method requires identifying and controlling external factors that may affect results.
Attribution and uplift calculation: formulas and cautions
Attribution consists in linking an observed change in a commercial KPI to the avatar action. A simple and transparent rule eases acceptance by decision‑makers.
Basic formula to measure uplift on a conversion metric: Uplift = (Metric_variantB - Metric_variantA) / Metric_variantA, expressed as a proportion. To use it, clearly define Metric_variantA (control group) and Metric_variantB (group with avatar).
To measure impact on basket value, calculate the difference in average basket between visitors who interacted and those who did not within the same period and experimental perimeter. Be cautious of selection bias: visitors who interact may naturally differ from others.
Mapping data sources and SANIA integrations
Reliable reporting requires combining multiple sources: avatar interaction logs, point‑of‑sale (POS) data, in‑store traffic data, anonymized CRM data and possibly customer panels. Map in advance which sources are needed for each KPI and verify access modalities.
On the technical side, SANIA can call webhooks or HTTP endpoints and be linked to external tools through specific integrations. This enables exporting interaction events (interaction start, intent identified, transfer to human if configured, etc.) to a central collector to enrich analyses.
Examples of mapping between sources and KPIs: interaction logs feed engagement rate and average interaction time; POS provides basket value and conversion; traffic data gives exposure context. Establishing a common anonymous identifier allows linking interaction and transaction without exposing personal data.
Operational dashboard: which views to include
A dashboard aimed at decision‑makers must be concise, show trends and allow drilling down. Separate business views from technical views so each owner quickly gets useful information.
Recommended views: engagement trends by store or zone, comparison of conversions between variants, evolution of basket value for visitors who interacted, heatmap of most frequent intents, and technical health status (availability, critical errors, voice recognition rate).
Accompany charts with an 'interpretation' column explaining data limitations and attribution assumptions. This prevents misinterpretation and eases discussion with leadership.
Privacy‑safe data collection and best practices
Measurement must respect privacy. Plan a data governance that defines what is stored, for which purpose and for how long. Depending on configuration, some voice interactions or logs may be retained; prefer minimization and clear retention periods.
Concrete measures to consider: pseudonymization of identifiers, encrypted storage of sensitive logs, anonymization before cross‑referencing with POS data, clarity on consent when voice is recorded, and restricted access to raw data only for teams that need it.
SANIA can be deployed in cloud, edge or hybrid configurations. This choice impacts data localization and risks. Consult legal and security teams to define retention policy and access controls.
Operational checklist for a convincing pilot
Before presenting results to leadership, validate that the pilot respects methodological rigor and required compliance.
Define clear business objectives and associated KPIs.
Choose an appropriate experimental method (A/B, cohorts, before/after) and document the attribution rule.
Map the necessary data sources and access modalities for POS, logs and traffic.
Set up export of interaction events from SANIA via webhooks or configured endpoints.
Validate the anonymous identifier chain to link interaction and transaction without personally identifiable data.
Formalize the retention policy for logs and voice recordings according to the minimization principle and obtain required internal legal approvals. Attention to local requirements and any necessary consents.
Common mistakes and cautionary points
Expecting miracles in the first weeks. Measurable effects depend on traffic, seasonality and the maturity of business content provided to the avatar. Present nuanced results and document assumptions.
Poor alignment between KPI and business objective. For example, measuring only the number of interactions without linking them to commercial outcomes makes the argument incomplete.
Ignoring transaction data quality. Check POS granularity and export delays before starting the experiment.
Neglecting explainability. Decision‑makers want to understand the method. Describe the attribution logic, limitations and alternative scenarios clearly.
Conclusion and next practical steps
Measuring the ROI of an in‑store AI avatar requires combining methodological rigor, data mapping and privacy requirements. By adopting relevant business and technical KPIs, choosing an appropriate experimentation method and building a clear dashboard, you increase your chances of convincing leadership.
SANIA can be deployed on a screen or kiosk, operate via voice and touch depending on configuration, and be linked to endpoints or webhooks to export interaction events. To evaluate concretely how these capabilities can integrate with your POS sources and reporting, you can request a SANIA demonstration and discuss a pilot protocol adapted to your store network.